Hey, look, the Earth keeps getting hotter:
Remember when 2014 was the hottest year on record? Then 2015? Well, now it’s 2016.

(NASA)
On Wednesday, both NASA and the National Oceanic and Atmospheric Administration released separate analyses showing that 2016 was very likely the hottest year ever recorded. The previous record hot year was ... 2015. The record hot year before that was ... 2014. Notice a trend?
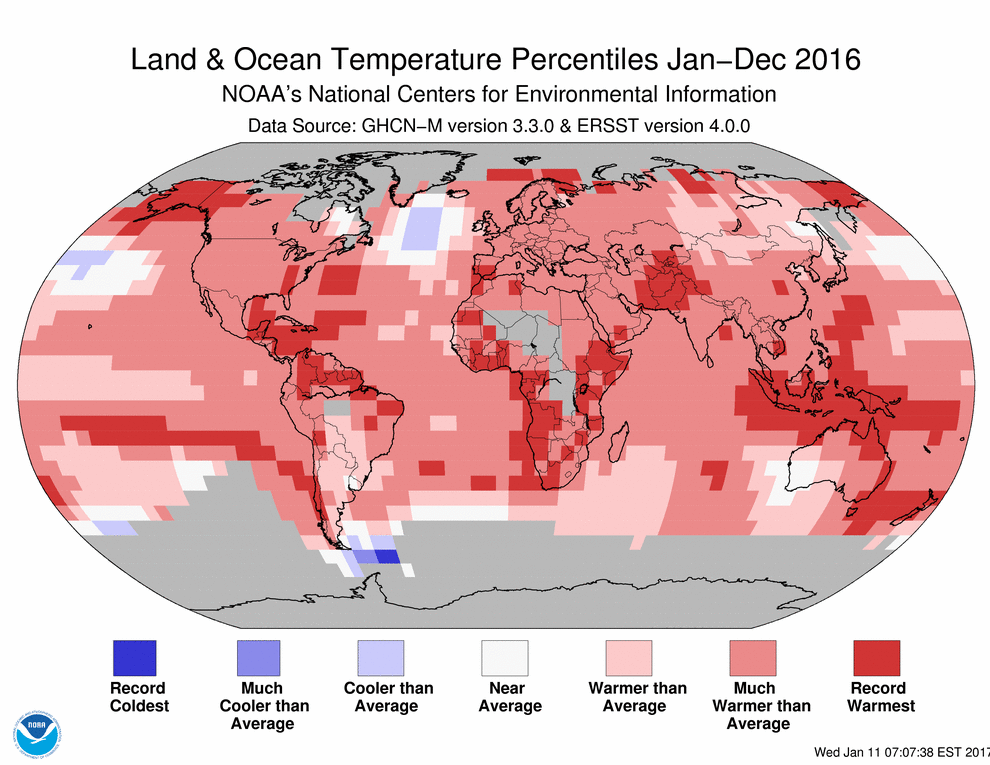
NASA says 2016 was 1.78°F (0.99°C) warmer than the mid-20th-century average. NOAA says 2016 was 1.69°F (0.96°C) warmer than the 20th-century average. And it wasn’t just one region: it was a toasty year all over the globe, with places as far-flung as Alaska, Pakistan, Indonesia, and large patches in the Pacific Ocean all setting records. The Arctic, in particular, was 7.2°F (4°C) hotter than usual, according to NASA, which explains why we’ve seen record low sea ice for the past few months.
In a tidy little coincidence, this stark sign of man-made global warming came right as the Senate was holding a confirmation hearing for Scott Pruitt, Trump’s nomination for head of the Environmental Protection Agency — a man who has long sued to block most of President Obama’s efforts to rein in greenhouse gas emissions. It’s a good reminder that physics doesn’t care much about what’s going on in Washington, DC.
Global warming and El Niño combined to help 2016 shatter temperature records
Two things helped 2015 and 2016 reach hot new highs. First, an extraordinarily strong El Niño unfolded in the Pacific Ocean in 2015 and early 2016. El Niños are periodic phenomena that occur when the trade winds that typically blow east to west in the tropics start to weaken. That ends up disrupting weather patterns all around the world. It also causes some of the heat that was stored in deeper layers of the ocean to rise to the surface, bumping up global temperatures. (See here for our explainer on how El Niño works.)
Last year’s El Niño was one of the strongest ever seen, reaching its maximum in the winter. Its telltale footprint — an unusually warm patch in the east tropical Pacific — could still be made out in 2016:

Still, El Niño can’t be the only thing going on. After all, El Niños recur periodically — most recently, there was a massive one in 1997-‘98. But 2015 and 2016 were much hotter than 1998. And 2014 wasn’t even an El Niño year.
The other big story, of course, is global warming caused by increased greenhouse gases in the atmosphere. As you can see from the graph below, even El Niño and La Niña years keep getting hotter over time:

The basics of global warming are now familiar to most people. As humans burn fossil fuels and add more carbon dioxide to the air, we steadily trap more heat on the Earth’s surface.
What’s less well-known is that more than 90 percent of that extra heat is absorbed by the oceans. So subtle interactions between the ocean and the atmosphere can cause fluctuations from year to year.
When a strong El Niño forms, more of that heat is transferred up to the surface, warming things up a bit. Scientists tend to think that El Niño has its biggest effect on global surface temperatures three months after peaking, which helps explain why 2016 was even hotter than 2015. (NASA estimates that El Niño added about 0.2°F or 0.12°C to 2016.)
By contrast, when those Pacific trade winds strengthen and a La Niña forms, more of that heat is trapped below the ocean surface, cooling things down a bit. Now that El Niño has subsided and a weak La Niña has formed, it’s quite likely that 2017 will be a bit cooler than 2016, though almost certainly still much hotter than the 20th-century average.
So as you can see, this cycle can lead to ups and downs over time. But as we emit more and more CO2, we keep trapping more heat overall. As the chart above shows, El Niño years are getting hotter over time. La Niña years are getting hotter. Normal years are getting hotter. The overall trend is ... hotter.


